|
|


Fat-containing
Lesions
of
the
Liver:
Radiologic-Pathologic
Correlation1
- Srinivasa R. Prasad, MD,
- Hanlin Wang, MD, PhD,
- Humberto Rosas, MD,
- Christine O. Menias, MD,
- Vamsi R. Narra, MD,
- William D. Middleton, MD and
- Jay P. Heiken, MD
+ Author Affiliations
-
1From the Department of Radiology, University of Texas Health Science Center at San Antonio (S.R.P.); the Department of Pathology and Immunology, Washington University, St Louis, Mo (H.W.); and the Department of Radiology, Mallinckrodt Institute of Radiology, 510 S Kingshighway Blvd, Ninth Floor, St Louis, MO 63110 (H.R., C.O.M., V.R.N., W.D.M., J.P.H.). Presented as an education exhibit at the 2002 RSNA Scientific Assembly. Received April 20, 2004; revision requested June 7; revision received and accepted June 30. All authors have no financial relationships to disclose.
- Address correspondence to
J.P.H. (e-mail: heikenj@mir.wustl.edu).
Abstract
Fat-containing tumors of the liver are a heterogeneous group of tumors with characteristic histologic features, variable biologic profiles, and variable imaging findings. Benign liver lesions that contain fat include focal or geographic fatty change (steatosis), pseudolesions due to postoperative packing material (omentum), adenoma, focal nodular hyperplasia, lipoma, angiomyolipoma, cystic teratoma, hepatic adrenal rest tumor, pseudolipoma of the Glisson capsule, and xanthomatous lesions in Langerhans cell histiocytosis. Malignant liver lesions that can contain fat include hepatocellular carcinoma, primary and metastatic liposarcoma, and hepatic metastases. Identification of fat within a liver lesion can be critical in characterization of the lesion. The imaging characteristics of a lesion coupled with the pattern of intratumoral fatty change are helpful in narrowing the differential diagnosis. Although the presence of fat can be demonstrated with computed tomography or ultrasound, magnetic resonance imaging is the most specific imaging technique for demonstration of both microscopic and macroscopic fat.
© RSNA, 2005
LEARNING OBJECTIVES
After reading this article and taking the test, the reader will be able to:
-
List the wide spectrum of fat-containing lesions of the liver.
-
Identify the imaging features of fat-containing liver lesions and the corresponding gross pathologic and histologic appearances.
-
Describe the patterns of fatty change within hepatic neoplasms, a finding that may be helpful in differential diagnosis.
Introduction
A variety of liver lesions ranging from benign entities to malignant neoplasms may contain fat. The benign lesions include focal or geographic fatty change (steatosis), hepatocellular adenoma, focal nodular hyperplasia, lipoma, angiomyolipoma, teratoma, hepatic adrenal rest tumor, pseudolipoma of the Glisson capsule, and xanthomatous lesions in Langerhans cell histiocytosis. Malignant tumors that can contain fat primarily include hepatocellular carcinoma and primary and meta-static liposarcoma. This article reviews the spectrum of focal fat-containing lesions in the liver, focusing on the imaging characteristics and pathologic correlation (Tables 1, 2).
Table 1.Liver Lesions Containing Macroscopic Fat
Table 2.Liver Lesions Containing Intracellular Lipid
Fat has a characteristic appearance with each of the major cross-sectional imaging modalities. It usually appears hyperechoic at ultrasound (US), although fat in some regions may appear hypoechoic (1). Fat attenuates sound more than the adjacent liver parenchyma, so partial acoustic shadowing may occur deep to fatty tumors. Since the speed of sound is less in fat than in other soft tissues, speed propagation artifacts and refraction artifacts can occur with fatty tumors (2). Fat is of low attenuation compared with normal liver parenchyma at computed tomography (CT), with a range of −10 to −100 HU, and high in signal intensity on T1-weighted magnetic resonance (MR) images (3).
In addition, several MR imaging sequences aid in the detection of fat, including fat suppression sequences and chemical shift imaging with opposed-phase gradient-echo (GRE) sequences (4). The absence of a 180° refocusing radiofrequency pulse in GRE sequences results in the temporal cycling of lipid and water proton signals in and out of phase with respect to each other (4). At 1.5 T, lipid and water protons precess in phase approximately every 4.2 msec. During in-phase imaging, the lipid and water signals are additive. Imaging during intermediate echo times of approximately 2.1 msec and 6.3 msec, when lipid and water protons are out of phase, leads to phase cancellation effect at a voxel level, resulting in loss of signal in voxels with fat and water. Thus, appropriate selection of echo time can be used to obtain images with differing relative contributions of fat and water signals. For example, images obtained with an out-of-phase echo time demonstrate a conspicuous drop in signal intensity in tissues containing equimolar amounts of water and lipid, compared with the signal intensity on equivalent in-phase images. The out-of-phase GRE sequence is a useful technique for diagnosis of both diffuse and focal hepatic steatosis.
Benign Fat-containing Liver Lesions
Hepatic Steatosis
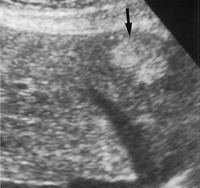
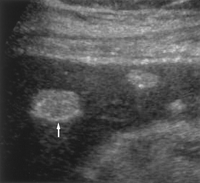
Hepatic steatosis can be either diffuse or focal. Focal steatosis is often easily recognized on the basis of the typical periligamentous or periportal location, the distribution of the lesions, and the presence of nondistorted, traversing blood vessels (Figs 1, 2). However, patchy focal fat deposition or sparing may be mistaken for an infiltrative neoplasm (5) (Fig 3). Multifocal nodular steatosis (MNS) can simulate metastatic disease at US, CT, and MR imaging (6) (Fig 4). The combination of in-phase and opposed-phase GRE imaging allows reliable differentiation of MNS from meta-static disease.
Figure 1. Focal hepatic steatosis. Axial US scan of the liver shows an ovoid, uniformly hyperechoic focus (arrow), a finding consistent with focal fat.
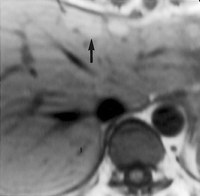
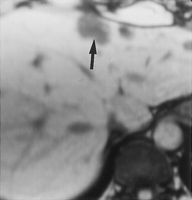
Figure 2a. Focal hepatic steatosis. (a) Axial in-phase T1-weighted MR image shows peripheral high-signal-intensity foci (arrow). (b) Axial opposed-phase T1-weighted MR image shows a uniform decrease in the signal intensity of the foci (arrow).
Figure 2b. Focal hepatic steatosis. (a) Axial in-phase T1-weighted MR image shows peripheral high-signal-intensity foci (arrow). (b) Axial opposed-phase T1-weighted MR image shows a uniform decrease in the signal intensity of the foci (arrow).
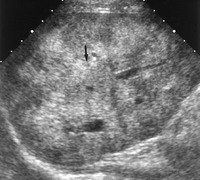
Figure 3. Axial US scan shows patchy, diffuse hepatic steatosis (arrow), which simulates an infiltrative tumor.
Figure 4a. Multinodular hepatic steatosis. (a) Axial in-phase T1-weighted GRE image shows subtle hyperintense foci (arrow). (b) Axial out-of-phase T1-weighted GRE image shows uniform signal loss in the foci (arrows).
Figure 4b. Multinodular hepatic steatosis. (a) Axial in-phase T1-weighted GRE image shows subtle hyperintense foci (arrow). (b) Axial out-of-phase T1-weighted GRE image shows uniform signal loss in the foci (arrows).
Fatty Pseudolesions of the Liver: Postoperative Changes
Omentum is often used as a packing material in hepatobiliary surgeries. It is important to recognize the imaging appearance of fatty omentum in postoperative patients (Fig 5).
Figure 5. Contrast-enhanced CT scan shows a fatty hepatic pseudomass due to omental packing (arrow). Such a pseudomass is a common postoperative finding.
Adenoma
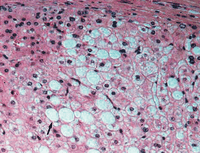
Hepatic adenoma is a benign, encapsulated neoplasm that shows a propensity to frequent hemorrhage and rare malignant change (Fig 6c). It most commonly occurs in young women taking oral contraceptives. Other risk factors include type I glycogen storage disease and use of anabolic steroids. Histologically, a hepatocellular adenoma consists of normal-appearing hepatocytes arranged in sheets and cords instead of the usual lobular architecture (Fig 6d). The presence of dilated sinusoids with scanty connective tissue support that are fed by prominent arteries predisposes to hemorrhage (7). The adenoma cells may be filled with glycogen and fat (Fig 6d). Intra- and intercellular lipid uncommonly manifests as macroscopic fat deposits within the tumor (Fig 7). In a series of hepatocellular adenomas imaged with CT, lipid deposition was seen in only 7% of lesions (8). In contrast, 35%–77% of adenomas demonstrate steatosis at chemical shift MR imaging (9,10) (Fig 6a, 6b). These findings correlate with the variable lipid content of adenomas and the superior contrast resolution and tissue distinction of MR imaging compared with CT.
Figure 6a. Hepatic adenoma. (6a) Axial in-phase T1-weighted GRE image shows a large, hypointense mass in the right hepatic lobe (arrow). (6b) Axial out-of-phase T1-weighted GRE image shows a homogeneous decrease in the signal intensity of the adenoma (arrow). (6c) Photograph of the gross pathologic specimen shows areas of hemorrhage (arrow). (6d) Photomicrograph (original magnification, ×200; hematoxylin-eosin stain) shows intracytoplasmic fat vacuoles (arrow) within adenoma cells.
Figure 6b. Hepatic adenoma. (6a) Axial in-phase T1-weighted GRE image shows a large, hypointense mass in the right hepatic lobe (arrow). (6b) Axial out-of-phase T1-weighted GRE image shows a homogeneous decrease in the signal intensity of the adenoma (arrow). (6c) Photograph of the gross pathologic specimen shows areas of hemorrhage (arrow). (6d) Photomicrograph (original magnification, ×200; hematoxylin-eosin stain) shows intracytoplasmic fat vacuoles (arrow) within adenoma cells.
Figure 6c. Hepatic adenoma. (6a) Axial in-phase T1-weighted GRE image shows a large, hypointense mass in the right hepatic lobe (arrow). (6b) Axial out-of-phase T1-weighted GRE image shows a homogeneous decrease in the signal intensity of the adenoma (arrow). (6c) Photograph of the gross pathologic specimen shows areas of hemorrhage (arrow). (6d) Photomicrograph (original magnification, ×200; hematoxylin-eosin stain) shows intracytoplasmic fat vacuoles (arrow) within adenoma cells.
Figure 6d. Hepatic adenoma. (6a) Axial in-phase T1-weighted GRE image shows a large, hypointense mass in the right hepatic lobe (arrow). (6b) Axial out-of-phase T1-weighted GRE image shows a homogeneous decrease in the signal intensity of the adenoma (arrow). (6c) Photograph of the gross pathologic specimen shows areas of hemorrhage (arrow). (6d) Photomicrograph (original magnification, ×200; hematoxylin-eosin stain) shows intracytoplasmic fat vacuoles (arrow) within adenoma cells.
Figure 7. Nonenhanced CT scan of a patient with multiple adenomas shows macroscopic fat deposition (arrow).
Focal Nodular Hyperplasia
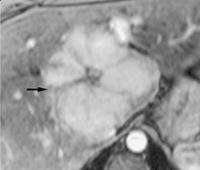
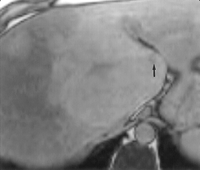
Focal nodular hyperplasia (FNH) is the second most common benign hepatic lesion following hemangioma. It occurs predominantly in young asymptomatic women and is often discovered incidentally. Histologically, FNH consists of hepatocyte nodules that are circumscribed by fibrous septa containing bile ducts and mononuclear inflammatory cells (Fig 8c). In contradistinction to adenomas, which hemorrhage and have malignant potential, FNH exhibits benign behavior.
Figure 8a. Focal nodular hyperplasia. (a) Axial arterial phase T1-weighted MR image shows a lobulated, well-circumscribed tumor with intense and uniform enhancement (arrow). (b) Axial opposed-phase T1-weighted GRE image shows a patchy peripheral focus of low signal intensity (arrow), which represents a focal fat deposit. (c) Photomicrograph (original magnification, ×200; hematoxylin-eosin stain) shows intracellular fat vacuoles (arrow).
Figure 8b. Focal nodular hyperplasia. (a) Axial arterial phase T1-weighted MR image shows a lobulated, well-circumscribed tumor with intense and uniform enhancement (arrow). (b) Axial opposed-phase T1-weighted GRE image shows a patchy peripheral focus of low signal intensity (arrow), which represents a focal fat deposit. (c) Photomicrograph (original magnification, ×200; hematoxylin-eosin stain) shows intracellular fat vacuoles (arrow).
Figure 8c. Focal nodular hyperplasia. (a) Axial arterial phase T1-weighted MR image shows a lobulated, well-circumscribed tumor with intense and uniform enhancement (arrow). (b) Axial opposed-phase T1-weighted GRE image shows a patchy peripheral focus of low signal intensity (arrow), which represents a focal fat deposit. (c) Photomicrograph (original magnification, ×200; hematoxylin-eosin stain) shows intracellular fat vacuoles (arrow).
At US, FNH is typically isoechoic to liver parenchyma. Color and power Doppler US often show a characteristic “spoke-wheel” pattern of internal vascularity (11). At CT and MR imaging, FNH demonstrates brisk, intense, homogeneous contrast enhancement with rapid contrast material washout (Fig 8a). A central scar that is bright on T2-weighted images and shows delayed contrast enhancement is a characteristic feature.
The presence of fat in FNH is extremely rare and is usually patchy in distribution (12) (Fig 8b, 8c). Intratumoral steatosis may or may not be associated with diffuse hepatic steatosis. Eisenberg et al (13) proposed that intratumoral steatosis might result either from ischemia possibly from tumoral compression of adjacent liver or from as yet unknown tumor-related by-products. Intratumoral steatosis is better demonstrated at MR imaging (14).
Lipoma
Hepatic lipomas are extremely uncommon (15). Histologically, these lesions consist of mature adipose tissue. Lipomas have characteristic findings at imaging. At US, they appear as well-circumscribed, uniformly hyperechoic lesions (Fig 9). At CT and MR imaging, lipomas demonstrate pathognomonic characteristics of a fatty lesion.
Figure 9. Axial US scan shows uniformly hyper-echoic lesions (arrow), which represent hepatic lipomas.
Angiomyolipoma
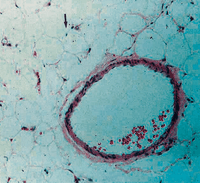
Angiomyolipoma (AML) is a benign, unencapsulated mesenchymal tumor that is composed of varying proportions of three elements: smooth muscle cells, thick-walled blood vessels, and mature adipose tissue (Fig 10b, 10c). AML occurs more commonly in the kidneys; hepatic involvement is rare. In contrast to renal AML, which is associated with tuberous sclerosis in 20% of patients, hepatic AML is associated with tuberous sclerosis in only 6% (16). AML can be histologically classified on the basis of fat content into mixed, lipomatous (≥70% fat), myomatous (≤10% fat), and angiomatous types (17).
Figure 10a. Hepatic angiomyolipoma. (a) Contrast-enhanced CT scan shows a well-circumscribed, heterogeneous tumor of the right lobe with foci of fat (arrow). (b) Photograph of the gross specimen shows that the tumor is large and lobulated with areas containing fat (arrow). (c) Photomicrograph (original magnification, ×200; hematoxylin-eosin stain) shows proliferating smooth muscle (arrow), vessels, and adipose tissue (arrowheads).
Figure 10b. Hepatic angiomyolipoma. (a) Contrast-enhanced CT scan shows a well-circumscribed, heterogeneous tumor of the right lobe with foci of fat (arrow). (b) Photograph of the gross specimen shows that the tumor is large and lobulated with areas containing fat (arrow). (c) Photomicrograph (original magnification, ×200; hematoxylin-eosin stain) shows proliferating smooth muscle (arrow), vessels, and adipose tissue (arrowheads).
Figure 10c. Hepatic angiomyolipoma. (a) Contrast-enhanced CT scan shows a well-circumscribed, heterogeneous tumor of the right lobe with foci of fat (arrow). (b) Photograph of the gross specimen shows that the tumor is large and lobulated with areas containing fat (arrow). (c) Photomicrograph (original magnification, ×200; hematoxylin-eosin stain) shows proliferating smooth muscle (arrow), vessels, and adipose tissue (arrowheads).
US, CT, and MR imaging typically demonstrate the fat component and prominent central vessels. At US, AML may be highly echogenic and is then indistinguishable from a hemangioma. When present, sound attenuation, speed propagation artifact, and refraction artifact allow distinction of AML from other echogenic tumors, especially hemangiomas (2). At CT, AML has been reported to consist of two parts: a peripheral angiomyomatous component with soft-tissue attenuation and a fatty component with an attenuation value less than −20 HU (18) (Fig 10a). MR imaging characteristics vary depending on the proportion of intratumoral fat (19). Frequently, AML has a high fat content, with high signal intensity on T1-weighted images and a significant drop in signal intensity on fat-suppressed images.
AML demonstrates early intense contrast enhancement that peaks later than that of a hepato-cellular carcinoma (HCC) (18). Dynamic contrast-enhanced CT or MR images obtained during the early phase of enhancement may be useful in discriminating between AML and fat-containing HCC. The fatty areas of AMLs are well vascularized and enhance early, whereas steatotic foci in HCC are relatively avascular and have less contrast enhancement (19). However, unlike renal AML, 50% of hepatic AMLs lack considerable fat content (17). Because of this variable fat content, it is difficult to accurately distinguish AML from other hepatic tumors.
Cystic Teratoma
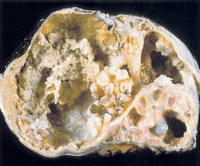
True liver cystic teratomas are extremely rare, with only a few isolated case reports in the radiology literature (20,21). Most so-called “hepatic teratomas” represent either intraperitoneal or retroperitoneal teratomas that have invaded the liver. Teratomas are benign, encapsulated tumors that arise from pluripotential cells. They frequently have components derived from all three germ layers, that is, ectoderm, endoderm, and mesoderm (22). The cystic mass frequently contains fat, hair, proteinaceous debris, and calcification. Imaging features reflect tissue heterogeneity (Fig 11b, 11c). The finding of a mass containing fat, fluid, and calcification is virtually diagnostic of a teratoma (Fig 11a) (22).
Figure 11a. Hepatic invasion by a primarily retroperitoneal teratoma. (a) Contrast-enhanced CT scan shows a predominantly fatty mass with a peripheral rim and central chunky calcification (arrow). (b) Photograph of the gross specimen shows that the mass is cystic with solid areas and papillary fronds. (c) Photomicrograph (original magnification, ×400; hematoxylin-eosin stain) of a portion of the mass shows mature adipose tissue (arrow) and blood vessels.
Figure 11b. Hepatic invasion by a primarily retroperitoneal teratoma. (a) Contrast-enhanced CT scan shows a predominantly fatty mass with a peripheral rim and central chunky calcification (arrow). (b) Photograph of the gross specimen shows that the mass is cystic with solid areas and papillary fronds. (c) Photomicrograph (original magnification, ×400; hematoxylin-eosin stain) of a portion of the mass shows mature adipose tissue (arrow) and blood vessels.
Figure 11c. Hepatic invasion by a primarily retroperitoneal teratoma. (a) Contrast-enhanced CT scan shows a predominantly fatty mass with a peripheral rim and central chunky calcification (arrow). (b) Photograph of the gross specimen shows that the mass is cystic with solid areas and papillary fronds. (c) Photomicrograph (original magnification, ×400; hematoxylin-eosin stain) of a portion of the mass shows mature adipose tissue (arrow) and blood vessels.
Adrenal Rest Tumor
Adrenal rest tumor is an ectopic collection of adrenocortical cells in an extra-adrenal site (23). This tumor may be nonfunctional or hormonally active and manifesting as an endocrine syndrome (24). Histologically, hepatic adrenal rest tumors (HARTs) are composed of low columnar or cuboidal clear cells, similar to adrenocortical tumors. Among the histologic constituents of HART, the presence of fat within the tumor is the most characteristic feature. At imaging, HART is typically subcapsular, demonstrating macroscopic fat and hypervascularity (23) (Fig 12). Differentiation of HART from angiomyolipoma or HCC with steatosis may be difficult at both imaging and histologic analysis.
Figure 12. Nonenhanced CT scan shows a heterogeneous lesion in the right lobe that contains macroscopic fat (arrow). Histopathologic analysis demonstrated a hepatic adrenal rest tumor.
Pseudolipoma of the Glisson Capsule
Also known as hepatic pseudolipoma, pseudolipoma of the Glisson capsule was described by Rolleston in 1891. Pseudolipoma refers to an encapsulated lesion containing degenerated fat that is enveloped by a liver capsule. It is thought to represent a detached colonic epiploic appendix that develops a fibrous capsule and lodges in the peritoneal cavity (25). When this lesion is in close proximity to the liver, it may become attached to the liver capsule. Differential diagnoses of this uncommon entity include serosal metastasis and fibrosing subcapsular necrotic nodule (25). At imaging, it appears as a well-circumscribed nodule on the liver surface with a center of either fat or soft-tissue attenuation.
Xanthomatous Lesions in Langerhans Cell Histiocytosis
Langerhans cell histiocytosis (LCH) is a multisystem disorder of variable clinical severity. It is characterized by inappropriate proliferation of Langerhans cells, the antigen presenting cells (26,27). Hepatic involvement is uncommon and usually seen in patients with extensive LCH. The liver lesions are characteristically located in the periportal region and have been staged into four different histologic phases: proliferative, granulomatous, xanthomatous, and fibrous (27). Xanthomatous lesions appear uniformly hyperechoic at sonography, have low attenuation at CT, and display characteristics of fat at MR imaging (26).
Malignant Fat-containing Liver Lesions
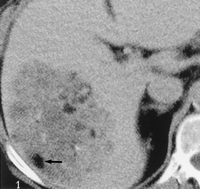
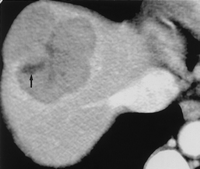
Hepatocellular Carcinoma
Hepatocellular carcinoma (HCC) is the commonest primary hepatic malignant neoplasm that commonly develops in a cirrhotic liver. Small (<1.5 cm) well-differentiated HCCs are often associated with a diffuse-type fatty change (Fig 13a). Larger tumors have patchy fatty metamorphosis (Fig 13b). Fatty change can be seen in up to 35% of small HCCs and is associated with a decrease in the number of intratumoral arteries without any difference in intratumoral portal tracts (28). In contradistinction to the uniform fat deposition in adenomas, fat deposition in HCCs is usually patchy (Fig 13a). Macroscopic fat within HCC is well demonstrated on CT scans (Fig 13a). HCC with fatty change appears hyper-intense on T1-weighted images and demonstrates signal intensity drop on chemical shift images. The hyperintensity of HCC on T1-weighted images is attributed to a number of factors, including hemorrhage, intratumoral deposition of fat, and/or the copper and zinc content of surrounding liver parenchyma (29).
Figure 13a. Hepatocellular carcinoma. (a) CT scan shows patchy macroscopic fat deposition (□) in a large, heterogeneously enhancing hepatoma. (b) Photomicrograph (original magnification, ×200; hematoxylin-eosin stain) shows fat vacuoles within tumor cells (arrow).
Figure 13b. Hepatocellular carcinoma. (a) CT scan shows patchy macroscopic fat deposition (□) in a large, heterogeneously enhancing hepatoma. (b) Photomicrograph (original magnification, ×200; hematoxylin-eosin stain) shows fat vacuoles within tumor cells (arrow).
Liposarcoma
Liposarcoma is an uncommon malignant mesenchymal tumor that accounts for 15% of all sarcomas. Metastatic spread of retroperitoneal and extremity liposarcomas is relatively common, but the liver is involved in only 10% of cases (Fig 14). Most hepatic liposarcomas are metastatic; isolated cases of primary hepatic liposarcomas have been reported (30,31).
Figure 14a. Hepatic liposarcoma. (a) Serial surveillance contrast-enhanced CT scan obtained after resection of an extremity liposarcoma shows a fatty hepatic metastasis (arrow). (b) Photomicrograph (original magnification, ×200; hematoxylin-eosin stain) shows lipoblasts with hyperchromatic nuclei (arrow) in a vascular stroma, an appearance consistent with a liposarcoma.
Figure 14b. Hepatic liposarcoma. (a) Serial surveillance contrast-enhanced CT scan obtained after resection of an extremity liposarcoma shows a fatty hepatic metastasis (arrow). (b) Photomicrograph (original magnification, ×200; hematoxylin-eosin stain) shows lipoblasts with hyperchromatic nuclei (arrow) in a vascular stroma, an appearance consistent with a liposarcoma.
Hepatic Metastases
In general, liver metastases do not contain fat. Exceptional examples of hepatic metastases with foci of fat exist (Fig 15).
Figure 15. Contrast-enhanced CT scan shows hepatic metastases containing foci of fat (arrow). The metastases were from an intestinal tumor synthesizing vasoactive intestinal peptide.
Conclusions
Fat-containing liver tumors constitute a heterogeneous group of tumors with characteristic histologic and variable imaging findings. Identification of fat within a liver lesion can be critical in characterizing it. The imaging characteristics of the fat components of a lesion combined with other imaging features of the lesion are helpful in narrowing the differential diagnosis. Although the presence of fat can be documented with CT or US, MR imaging is the most specific imaging technique for demonstrating both microscopic and macroscopic fat.
GRE
=
gradient
echo;
HCC
=
hepatocellular
carcinoma
References
- ↵
Heinz-PeerG, Oettl C, Mayer G, Mostbeck GH. Hypoechoic perirenal fat in renal transplant recipients. Radiology1994; 193: 717–720.
- ↵
MusanteF, Derchi LE, Zappasodi F, et al. Myelolipoma of the adrenal gland: sonographic and CT features. AJR Am J Roentgenol1988; 151: 961–964.
- ↵
MathieuD, Paret M, Mahfouz AE, et al. Hyperintense benign liver lesions on spin-echo T1-weighted MR images: pathologic correlations. Abdom Imaging1997; 22: 410–417.
- ↵
DelfautEM, Beltran J, Johnson G, Rousseau J, Marchandise X, Cotten A. Fat suppression in MR imaging: techniques and pitfalls. RadioGraphics1999; 19: 373–382.
- ↵
RubaltelliL, Savastano S, Khadivi Y, Stramare R, Tregnaghi A, Da Pian P. Targetlike appearance of pseudotumors in segment IV of the liver on sonography. AJR Am J Roentgenol2002; 178: 75–77.
- ↵
KemperJ, Jung G, Poll LW, Jonkmanns C, Luthen R, Moedder U. CT and MRI findings in multifocal hepatic steatosis mimicking malignancy. Abdom Imaging2002; 27: 708–710.
- ↵
GrazioliL, Federle MP, Brancatelli G, Ichikawa T, Olivetti L, Blachar A. Hepatic adenomas: imaging and pathologic findings. RadioGraphics2001; 21: 877–892.
- ↵
IchikawaT, Federle MP, Grazioli L, Nalesnik M. Hepatocellular adenoma: multiphasic CT and histopathologic findings in 25 patients. Radiology2000; 214: 861–868.
- ↵
ChungKY, Mayo-Smith WW, Saini S, Rahmouni A, Golli M, Mathieu D. Hepatocellular adenoma: MR imaging features with pathologic correlation. AJR Am J Roentgenol1995; 165: 303–308.
- ↵
ArriveL, Flejou JF, Vilgrain V, et al. Hepatic adenoma: MR findings in 51 pathologically proved lesions. Radiology1994; 193: 507–512.
- ↵
WangLY, Wang JH, Lin ZY, et al. Hepatic focal nodular hyperplasia: findings on color Doppler ultrasound. Abdom Imaging1997; 22: 178–181.
- ↵
StanleyG, Jeffrey RB Jr, Feliz B. CT findings and histopathology of intratumoral steatosis in focal nodular hyperplasia: case report and review of the literature. J Comput Assist Tomogr2002; 26: 815–817.
- ↵
EisenbergLB, Warshauer DM, Woosley JT, Cance WG, Bunzendahl H, Semelka RC. CT and MRI of hepatic focal nodular hyperplasia with peripheral steatosis. J Comput Assist Tomogr1995; 19: 498–500.
- ↵
ChaouiA, Mergo PJ, Lauwers GY. Unusual appearance of focal nodular hyperplasia with fatty change. AJR Am J Roentgenol1998; 171: 1433–1434.
- ↵
JoverJM, Carabias A, Ramos JL, Ortega P, Ruiz de Adana JC, Moreno Azcoita M. Lipoma of the liver associated with hepatocellular carcinoma and polycystic liver disease. Dig Surg2001; 18: 323–324.
- ↵
ChaI, Cartwright D, Guis M, Miller TR, Ferrell LD. Angiomyolipoma of the liver in fine-needle aspiration biopsies: its distinction from hepatocellular carcinoma. Cancer1999; 87: 25–30.
- ↵
TsuiWM, Colombari R, Portmann BC, et al. Hepatic angiomyolipoma: a clinicopathologic study of 30 cases and delineation of unusual morphologic variants. Am J Surg Pathol1999; 23: 34–48.
- ↵
AhmadiT, Itai Y, Takahashi M, et al. Angiomyolipoma of the liver: significance of CT and MR dynamic study. Abdom Imaging1998; 23: 520–526.
- ↵
YanF, Zeng M, Zhou K, et al. Hepatic angiomyolipoma: various appearances on two-phase contrast scanning of spiral CT. Eur J Radiol2002; 41: 12–18.
- ↵
WinterTC 3rd, Freeny P. Hepatic teratoma in an adult: case report with a review of the literature. J Clin Gastroenterol1993; 17: 308–310.
- ↵
ConradRJ, Gribbin D, Walker NI, Ong TH. Combined cystic teratoma and hepatoblastoma of the liver: probable divergent differentiation of an uncommitted hepatic precursor cell. Cancer1993; 72: 2910–2913.
- ↵
PatankarT, Prasad S, Chaudhry S, Patankar Z. Benign cystic teratoma of the lesser omentum (letter). Am J Gastroenterol1999; 94: 288.
- ↵
TajimaT, Funakoshi A, Ikeda Y, et al. Nonfunctioning adrenal rest tumor of the liver: radiologic appearance. J Comput Assist Tomogr2001; 25: 98–101.
- ↵
ContrerasP, Altieri E, Liberman C, et al. Adrenal rest tumor of the liver causing Cushing’s syndrome: treatment with ketoconazole preceding an apparent surgical cure. J Clin Endocrinol Metab1985; 60: 21–28.
- ↵
QuinnAM, Guzman-Hartman G. Pseudolipoma of Glisson capsule. Arch Pathol Lab Med2003; 127: 503–504.
- ↵
RadinDR. Langerhans cell histiocytosis of the liver: imaging findings. AJR Am J Roentgenol1992; 159: 63–64.
- ↵
ChanYL, Li CK, Lee CY. Sonographic appearance of hepatic Langerhans cell histiocytosis. Clin Radiol1997; 52: 761–763.
- ↵
KutamiR, Nakashima Y, Nakashima O, Shiota K, Kojiro M. Pathomorphologic study on the mechanism of fatty change in small hepatocellular carcinoma of humans. J Hepatol2000; 33: 282–289.
- ↵
EbaraM, Fukuda H, Kojima Y, et al. Small hepatocellular carcinoma: relationship of signal intensity to histopathologic findings and metal content of the tumor and surrounding hepatic parenchyma. Radiology1999; 210: 81–88.
- ↵
TeasS, Ronan SG, Ghosh L. Solitary metastatic liposarcoma of the liver (letter). Arch Pathol Lab Med1978; 102: 605.
- ↵
NelsonV, Fernandes NF, Woolf GM, Geller SA, Petrovic LM. Primary liposarcoma of the liver: a case report and review of the literature. Arch Pathol Lab Med2001; 125: 410–412.
http://radiographics.rsna.com/content/25/2/321.full |
|